
Evaluations that hold up · Standard gear
You will be able to: design an evaluation for a Big Widget task, with held-out data that matches real use, a baseline, a metric tied to the harm and a sample size planned in advance; spot test-set contamination and test-set reuse, and explain why scores can drop on fresh data drawn the same way; and report a result with its uncertainty, say when a difference between two models is too small to act on, and check an LLM judge against people before trusting it.
Facts about particular studies, benchmarks and models are dated in the text. This module is as of November 2026. Big Widget Company is the made-up company used across this course; its plans, data and numbers here are made up for teaching, and are labelled as such.
1. The anchor case: same recipe, new test set, lower score
The usual way to say a model "generalizes" is to score it on a held-out test set. Recht, Roelofs, Schmidt and Shankar asked what that score really promises. At the very least, they wrote, "one would hope that the model also performs well on a new test set assembled from the same data source by following the same data cleaning protocol."1
So they built new test sets for two famous image benchmarks, CIFAR-10 and ImageNet, "by closely following the original dataset creation processes": the same image sources, a similar time frame for ImageNet's Flickr images, and annotation tasks modelled on the original ones.1 Then they re-scored a broad range of published models. The paper appeared at ICML 2019.1
The models did worse. Accuracy dropped by 3 to 15 percentage points on CIFAR-10 and 11 to 14 points on ImageNet.1 A ResNet-152, for example, went from 78.3% top-1 accuracy on the original ImageNet validation set to 67.0% on the new one.1 On ImageNet, the authors say, the loss "amounts to approximately five years of progress in a highly active period of machine learning research."1
Read the result carefully, because it is easy to over-read.
What the drop does show.
- A score on one test set is a measurement of that test set, not of the task. Even a careful copy of the recipe produced a test set the models found harder.1
- Small choices in how a test set is built move the score a lot. Using three different rules for which annotated images to keep, all from the same Flickr pool and all correctly labelled, the authors got average top-1 accuracies that varied by about 14 points.1 Their leading explanation for the drop is this kind of shift, which they call a "distribution gap". The main difficulty in copying the recipe, they suggest, "likely is the subjective nature of the human annotation step".1
- One test set per benchmark is not enough. The authors write that evaluating on "a single test set per benchmark" is "not comprehensive enough to characterize the reliability of current models".1
What the drop does not show.
- It does not show that the models had "memorised" the old test set. The authors expected that heavy reuse might cause adaptive overfitting and tested for it. They found the opposite of diminishing returns: "every percentage point of accuracy improvement on the original test set translates to a larger improvement on our new test sets", and concluded that adaptivity is "an unlikely explanation for the accuracy drops".1 They add that their experiments "do not exclude all variants" of it.1
- It does not show that the leaderboard ranking was wrong. The authors found that "the relative order of models is almost exactly preserved" on the new test sets.1 The ranking held up; the absolute number did not.
The misconception this corrects: "If the model never saw the test file, the score is clean." The ImageNet models never trained on the new images, and they still lost 11 to 14 points.1 Clean is necessary, not sufficient: a score also depends on how closely the test set matches the data you will really meet.
2. Contamination and reuse: two ways a test score lies
Contamination: the model has seen the test
Data contamination is, in general, "any breach in the strict control of datasets required by the experimental protocol".2 In a 2023 position paper, Sainz and colleagues focus on the case where a large language model processed an evaluation benchmark during pre-training, and argue that it causes "an overestimation of the performance of a contaminated model".2 They separate three kinds:2
- Guideline contamination: the model has seen the annotation guidelines for a dataset.
- Raw text contamination: the model has seen the original text before it was annotated; datasets built from Wikipedia are their example.
- Annotation contamination: the model has seen the labels. If the evaluation split leaked, "the experiment is completely invalidated". If only the train or development splits leaked, comparisons with models trained on those splits survive, but claims of zero-shot or few-shot performance do not.2
So "never saw the test file" is too narrow a check. A model can have seen the text the test was built from, or the guidelines, without ever loading your file.2 The HELM team (2022, published in TMLR 2023) also counts a model as contaminated if it was exposed to the evaluation distribution, not only the exact test items.3
Contamination is hard to rule out from outside. Training sets are web-scale, and for many models the corpus is not public.2 HELM's authors said they had "uneven and usually limited information" on how the 30 models they evaluated were trained, and so "cannot verify whether the model was trained on the data we evaluate it on".3 Sainz and colleagues add a contamination route that matters for any model reached through an API: such models "have been iteratively improved with user input, leading to evaluation data exposure".2 And a model that cannot recite a benchmark has not thereby proven it never trained on it. Whether a lack of memorisation shows a model was not trained on a benchmark is a question that, in the authors' words, "remains to be solved".2 So a failed memorisation probe goes in your report as "not detected", never as "clean".
What you can do:
- Keep your own test set private, and never paste its items into prompts, examples, bug reports or a vendor's tool. (That last part is this course's practice, following the API route above.)
- Where you can query the training data, search it. For open corpora, Sainz and colleagues propose measuring overlap as "the percentage of the benchmark that can be found in the pre-training dataset".2
- Record what you could not check. HELM flagged known contamination beside the results it affected.3 Do the same: "contamination not checked: vendor training data not disclosed" is an honest line in a report. Pair it with a next step and a name, such as who will ask the vendor.
Reuse: the team has seen the test
The second leak runs through people. Recht and colleagues call it the adaptivity gap: tuning a model's settings "directly on the test set" creates dependence between the model and the test, and "in the extreme case, this can be seen as training directly on the test set".1 Every time a team looks at test results and changes something, the test set becomes a little more like training data. In their image study this effect did not explain the drop, but they warn it has not been ruled out in every form, and suggest a "super hold-out": a test set kept hidden for years so that adaptive overfitting can be tested for later.1
At Big Widget, the rule that follows (this course's practice, not a finding of the cited studies) has three parts:
- A development set you look at as often as you like.
- A test set you open once, for one decision, at a size fixed in advance: the one-look rule. Once its result has been seen, it is no longer a test set. Logging the opening keeps an honest record; it does not make the set unseen again.
- A fresh test set for every new decision. If a result is too close to call, do not add items to the same test and run it again until the interval clears zero. That is the same feedback loop as tuning on the test, one look at a time. Move the used set into development, plan a new size, and draw a fresh test set from inputs the team has not seen. Count every attempt in the decision record.
A fresh test set makes each attempt's interval honest for that attempt. It does not stop one of many attempts from passing by luck. That is why every attempt is counted, and why the person who decides sees the whole count, not only the latest result.
Some designs plan several looks at the data in advance, with stricter rules for each look. They are outside this module. If your team wants one, it must be designed and written down before the first look, by someone qualified to do it.
3. Designing an evaluation that predicts real use
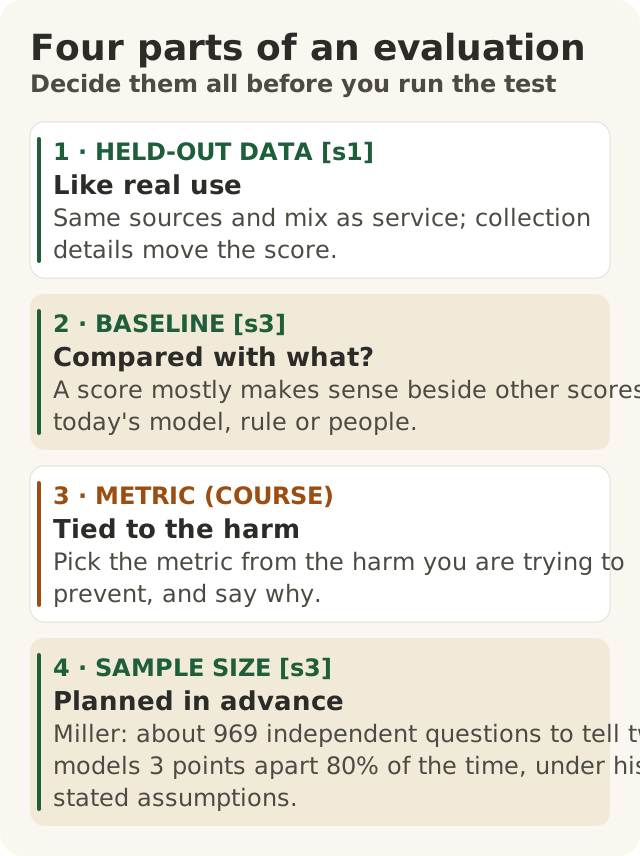
Figure data as text
Four parts of an evaluation
| Part | What it shows |
|---|---|
| 1 · HELD-OUT DATA [s1] | Like real use. Same sources and mix as service; collection details move the score. |
| 2 · BASELINE [s3] | Compared with what? A score mostly makes sense beside other scores: today's model, rule or people. |
| 3 · METRIC (COURSE) | Tied to the harm. Pick the metric from the harm you are trying to prevent, and say why. |
| 4 · SAMPLE SIZE [s3] | Planned in advance. Miller: about 969 independent questions to tell two models 3 points apart 80% of the time, under his stated assumptions. |
Why a leaderboard score is not your answer
A public benchmark score tells you how a model did on that benchmark, under that benchmark's conditions. Three findings above show why it does not carry over to your task: a new test built the same way scored lower;1 contamination inflates scores, and you usually cannot check for it;2 and conditions matter. HELM found that, before it, models had on average been evaluated on just 17.9% of its core scenarios, and that differences in few-shot prompting details lead to "wild swings in accuracies", from 30% to 80% for the same model on the same scenario.3 In 2023, Zheng and colleagues found that chat models people strongly preferred were not clearly separated from their base models by benchmarks such as MMLU and HELM.4
The misconception this corrects: "A public leaderboard score tells you how a model will do on your task." It tells you where to start looking. Your own evaluation tells you how it will do.
Four parts of an evaluation that holds up
1. Held-out data that matches real use. The test set should look like the inputs the model will meet in service: the same sources, the same mix, the same messiness, and from a period the model and the team did not use while building. Recht and colleagues showed that even subtle differences in how a test set is collected move the score.1 For a task where inputs change over time, a test set drawn from the most recent period is closer to next quarter than a random sample from the last five years. (That last point is this course's design advice, not a finding of the cited studies.)
2. A baseline. A score means little alone. Miller (2024) puts it plainly: a model's score on an eval "usually does not have any inherent meaning; it primarily makes sense in relation to the scores of other models".5 The baseline is whatever you would do without the new model: the current model, the current rule, or the current human process.
3. A metric tied to the harm. One number rarely captures what matters. HELM set out to measure seven things (accuracy, calibration, robustness, fairness, bias, toxicity and efficiency) for each core scenario where possible, which its authors report was 87.5% of the time, so that "metrics beyond accuracy don't fall to the wayside".3 Note that even HELM could not fill every cell, and said so. Pick the metric from the harm you are trying to prevent, and say why. Module 400.7 adds the next step: break the metric down by group, because an overall number can hide harm to one group.
4. A sample size planned in advance. How many test items you need depends on how small a difference you need to see. Miller gives a sample-size formula for this; in his worked example, with assumptions he calls "fictional" but "reasonable", detecting a 3-point difference between two models 80% of the time needs about 969 independent questions, which leads him to suggest that new evals should have "at least 1,000 questions".5 Section 4 shows how to read the uncertainty that the sample size buys you. Decide the size, the metric and the release rule before you run the test, so the result cannot shape the rule.
At Big Widget Company (made up for teaching)
Big Widget's warranty team receives free-text claims from dealers. The team wants a language model to flag claims that may describe a safety problem (brakes, steering, fire), so that a safety engineer reads them within one working day. Today a keyword rule does the flagging.
- Harm: a safety claim that is not flagged waits in the normal queue. So the main metric is the catch rate: of the claims that really are safety claims, the share the model flags. The second metric is the false-flag rate, because engineers who drown in false flags stop reading them.
- Baseline: the keyword rule, run on the same claims.
- Held-out data: every claim from the most recent full quarter, labelled by two safety engineers before any model sees it. Claims used to write or test the prompt are excluded. The test set is stored where the prompt writers cannot read it.
- Sample size: safety claims are rare, so the catch rate's denominator is the number of safety claims, not the number of claims. If about 3% of claims are safety claims, a test of 10,000 claims holds about 300 of them. (These are made-up planning numbers.)
- Release rule, written first and signed by the safety lead before the run: the model replaces the keyword rule only if, on one look at the paired test, the 95% interval for the difference in catch rate lies above zero, and its false-flag rate is no worse than the rule's by more than a limit the safety lead sets. In this course's gate words, that is go ahead. If the interval includes zero, the answer is wait for a person: the keyword rule stays, and the safety lead decides whether a new attempt is worth a fresh test set (section 2). If the model is clearly worse, the answer is no. The model never decides its own release; the safety lead does. A hold is not a yes waiting to happen: the decision record names who can release it.
4. Reporting a result honestly
Every score has an error bar
Miller treats the questions in an eval as a sample "drawn at random from a (hypothetical, infinite, unseen) super-population of questions".5 A different sample would give a different score. The standard error says by how much. For a score that is right or wrong on each item, with average score p on n items, the standard error is √(p(1 − p)/n), and a 95% confidence interval is the score ± 1.96 standard errors.5 Miller recommends reporting the number of questions and the standard error beside every score.5
A Big Widget example (made-up numbers): the model catches 270 of 300 safety claims, a catch rate of 90%. The standard error is √(0.9 × 0.1 / 300) ≈ 1.7 points, so the 95% interval is about 86.6% to 93.4%. Report "90% (SE 1.7 points; 300 safety claims)", not "90%".
Two warnings from the same paper:
- Related items make the error bar wider. When questions come in groups (several questions about one passage, or one question translated into many languages), treating them as independent understates the uncertainty. On real data, Miller's clustered standard errors were up to about three times the naive ones.5 At Big Widget, several claims about the same vehicle, or from the same dealer, may form such a group.
- Bigger test sets shrink the error bar. Recht and colleagues note that with 10,000 test points, a 95% confidence interval for accuracy is at most about ±1 point.1 Their 11-to-14-point drop was far outside that, which is why chance could not explain it.1 That bound assumes independent test points; a set of 10,000 claims that come in groups can have a wider one.
Is the difference big enough to act on?
When two models answer the same items, compare them item by item. Miller calls this a paired analysis and recommends it "wherever practicable": because models tend to find the same items easy or hard, the paired standard error is smaller than the naive one.5 Then look at the 95% interval for the difference.
- If the interval excludes zero, you have evidence of a real difference.
- If it includes zero, the data cannot tell the two models apart. Say so. That is not the same as showing they are equal.
The interval is built for one look at a sample size fixed in advance. Topping up the sample and looking again until it clears zero is the reuse problem from section 2.
Miller's own illustration uses two fictional models. One looks behind on two of three evals; after a paired analysis, its lead on one eval is statistically significant (+2.5 points, interval +1.2 to +3.8), while its deficits on the other two are "indistinguishable from statistical noise" (for example −2.7 points, interval −6.1 to +0.7).5 A superficial reading of the raw scores, he notes, would have picked the other model. He warns against the "highest number is best" mentality in which evals are commonly run and reported.5
The misconception this corrects: "A two-point gain on a benchmark is a real improvement." It might be. You cannot tell without the interval, and a gain that is real can still be too small to justify a change. Your release rule (section 3) says how big a difference must be before you act.
Checking an LLM judge against people
For open-ended outputs (a summary, an explanation) there is often no answer key, so teams use a strong language model as a judge. Zheng and colleagues studied this in 2023 with the judges of that time (GPT-4, GPT-3.5 and Claude-v1).4 They found real biases:
- Position bias: judges favoured an answer because of where it appeared. When two similar answers were swapped, GPT-4 gave a consistent verdict in 65% of cases, and the other judges did worse.4
- Verbosity bias: judges preferred a padded answer. A "repetitive list" made answers longer without adding information; it fooled GPT-3.5 and Claude-v1 on 91.3% of 23 answers and GPT-4 on 8.7%.4
- Self-enhancement: some judges gave their own model's answers higher win rates than people did, though the authors say their data could not settle whether this is a true bias.4
- Weak grading of maths and reasoning, even on problems the judge could solve alone. Giving the judge a reference answer cut GPT-4's failures on 10 maths questions from 14 of 20 judgments to 3 of 20.4
The headline finding was encouraging: GPT-4's verdicts agreed with expert people's about as often as experts agreed with each other.4 But the details show why you must check your own judge on your own task:
- Agreement depends on how you count. On first-turn MT-bench questions, counting ties, GPT-4 agreed with experts 66% of the time and experts with each other 63%, where two random judges would agree 33%. Leaving ties out, the figures were 85% and 81%, against 50% by chance.4
- Agreement was lowest on close calls. It rose "from 70% to nearly 100%" as the gap between the two models grew.4 Close calls are exactly the comparisons you need a judge for.
- The judge can sway the people. When an expert disagreed with GPT-4 and was then shown its reasoning, the expert judged it reasonable 75% of the time and changed their choice 34% of the time.4 So collect the people's labels before they see the judge's.
How to check a judge before trusting it (this course's procedure, built from the findings above):
- Fix the unit first: is each item one output graded alone (faithful or not), or a pair of answers compared? The people and the judge must label the same unit, under the same tie rule.
- Have at least two people label a sample of real items independently, before seeing the judge.
- Run the judge on the same items, twice with the order swapped if it compares pairs.4
- Compare like with like. Zheng and colleagues measure agreement as how often a randomly chosen member of one group agrees with a randomly chosen member of the other, on the same questions.4 So compare the judge with each person on all items, beside the people with each other on those same items. Add the chance rate and the number of items.
- Keep the items the people disagree on. They are the hard cases. Do not drop them to make the judge's number look cleaner; send them to a person to settle.
- Look at the disagreements, especially close calls and long answers.
- A named person decides, and writes down, what the judge may do: replace people (go ahead), pre-sort for people (only this far), or nothing (no).
The misconception this corrects: "An LLM judge agrees with people." Sometimes it agrees about as well as people agree with each other.4 Whether yours does on your task is a measurement, not an assumption.
At Big Widget Company (made up for teaching)
The warranty team wants a judge to grade whether the model's one-line claim summaries are faithful to the claim. Each summary is one unit, labelled "faithful" or "not faithful". Two engineers label 50 summaries independently and agree on 44 (88%).
- A tempting number: the judge matches the engineers on 36 of the 44 they agree on (82%). That is agreement with the engineers' consensus, on a subset with the hard cases removed. It is not the same measure as the engineers' 88%, so the two cannot be set side by side.
- The matched number: compare the judge with each engineer on all 50. On the 44 shared items it matches both engineers 36 times and neither 8 times. On the 6 disputed items, with only two labels, it must match exactly one engineer. So judge–engineer agreement is (36 × 2 + 6) / 100 = 78%, against 88% engineer–engineer, on the same 50 summaries. With only 50 items, both figures are uncertain; report n beside them.
- The disputed 6 go to the quality lead to settle, and are kept for the next check.
- The pattern: most of the judge's misses are long summaries it rated "faithful". That is a reason to test for verbosity bias on purpose, not proof that length caused the misses.
The team's decision record: the judge may not replace the engineers; it may sort summaries for the engineers to read first (only this far). The quality lead made that decision, and the record names the role and the date. The judge decides nothing.
5. The three yeses for an evaluation
An evaluation does not say yes. A person does, using it. The Foundation's three yeses (Get to Yes, Stay at Yes, Recover to Yes) are a cycle, not a one-time approval. They say what that person needs at each stage.
- Get to Yes: write the evaluation plan before the run: the test set and where it came from, the baseline, the metric and why it fits the harm, the sample size, and the release rule. Name the person who decides (at Big Widget, the safety lead), and have them sign the plan before anyone opens the test set. Add a "not checked" list, such as a vendor's training data.3 Each line on it names who will find out, or says that no one can. The honest standard is a sentence you can say: I know my test set's source, size and error bar, or I know that I do not. "Not detected" is not "clean" (section 2). A yes here is conditional: it covers this model, this task and this test, and nothing wider.
- Stay at Yes: re-check after every fine-tune or prompt change (module 400.2). Day-to-day checks can use the development set. A new release decision needs a fresh test set, under the one-look rule in section 2. Refresh the test set as real inputs change, and keep a hidden set back, in the spirit of Recht and colleagues' "super hold-out".1 Opened rarely, it tells you whether reuse has crept in.
- Recover to Yes: if you find a leak (test items in a prompt, or evidence that a model trained on your benchmark), the safety lead puts any release that relied on it on hold. Mark the affected results void and say so where they were reported. Sainz and colleagues call for the same in research: flag published work whose conclusions contamination has compromised.2 Voiding a result is not recovery. You are back at yes only when a fresh test set has been built, the evaluation re-run, and the safety lead has decided again on that new evidence.
What you keep, and where. Two different things:
- The work record, kept inside the team under its normal access rules: the evaluation plan, the dated test-set description, the results with their intervals, the judge check, and the disagreements. The test items and the claims themselves stay here, never anywhere public.
- The receipt for the decision: what was decided (go ahead, only this far, wait for a person, no), by which role, when, and a fingerprint of the plan it relied on. It holds no prompts, outputs, claims, customer details or test items. A fingerprint is not permission to share the plan itself. Module 400.8 shows how a stranger can check a receipt like this. A valid receipt proves the decision was recorded; it does not prove the model is good.
Words to know: held-out test set, development set, one-look rule, baseline, catch rate, distribution gap, adaptivity gap, contamination, not detected, not checked, standard error, confidence interval, paired comparison, LLM judge, position bias, verbosity bias, work record, receipt.