
What research can and cannot yet say about how models work · Standard gear
What you will be able to do
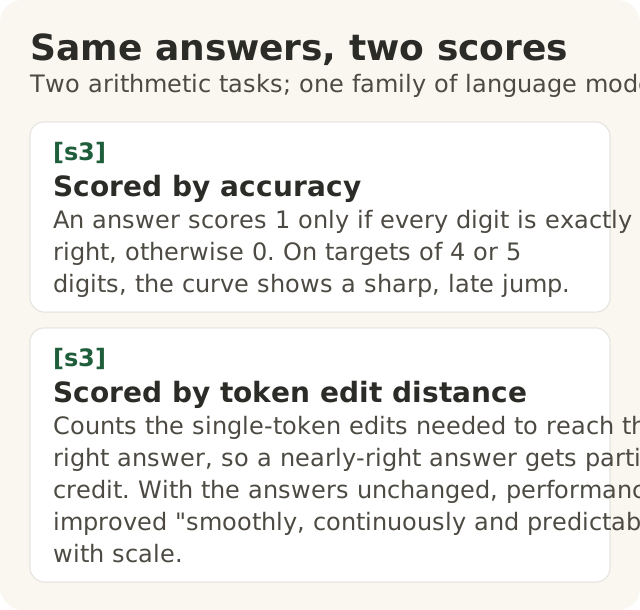
Figure data as text
Same answers, two scores
Two arithmetic tasks; one family of language models.
| Part | Wording | Sources |
|---|---|---|
| Scored by accuracy | An answer scores 1 only if every digit is exactly right, otherwise 0. On targets of 4 or 5 digits, the curve shows a sharp, late jump. | [s3] |
| Scored by token edit distance | Counts the single-token edits needed to reach the right answer, so a nearly-right answer gets partial credit. With the answers unchanged, performance improved "smoothly, continuously and predictably" with scale. | [s3] |
The same answers were scored by accuracy and token edit distance; the model outputs did not change between scorings (s3).
- Compare two published scaling-law summaries, state one prediction about loss that they support, and name one inference about a specific ability that they do not support.
- Critique a claim that an ability "emerged" at some scale, using two plots of the same results scored with different metrics: name the metric sensitivity, and say what the plots leave unresolved.
- State the conclusion a chain-of-thought faithfulness experiment supports, and one limit on it.
- From a toy-network study of superposition, separate what it shows about the toy mechanism from an unsupported claim that it explains a deployed model's decision.
This module is as of November 2026. Reviewed and published, version 1.0.0. It is not a credential.
It reads five papers from 2020 to 2023. It does not survey later work. Where this module says what "the research" shows, it means these five papers. Whether later studies changed any of these pictures is not checked here. Two of the five are preprints, not peer-reviewed (s1, s5).
The papers name the companies and models they studied. This module's text refers to them by the researchers' names and by plain descriptions, such as "the 280-billion-parameter model". The footnotes and sources.yml keep the full citations, so you can check every name yourself.
You bring two things from Level 400: in 400.1 you applied a compute and token scaling result, and in 400.6 you stated an evaluation's uncertainty. This module does not repeat the calculation. It asks a different question of each result: what does this evidence let you say, and what does it not?
Every section ends in the same three boxes:
- Supported: what the study's own evidence shows, in the setting it tested.
- Not established: a claim people make from the study that its evidence does not reach.
- Unresolved: a question the study leaves open, often in the authors' own words.
"Not established" does not mean false. It means this evidence does not show it.
1. Scaling laws predict loss, not abilities
Summary A: Kaplan et al. (2020)
Kaplan and colleagues trained Transformer language models across a wide range of sizes and measured their test loss: the cross-entropy of the model's predictions of the next token on held-out text.1 A token is a small piece of text, often a word or part of a word. They found that the loss "scales as a power-law with model size, dataset size, and the amount of compute used for training, with some trends spanning more than seven orders of magnitude".1 Other details of shape, such as width against depth, had "minimal effects within a wide range".1
Some of their findings, as they state them:
- When not held back by data or compute, doubling the number of parameters gives a loss smaller by a factor of about 0.95.1
- The loss "must flatten out eventually before reaching zero loss", though they saw no sign of that at the scales they tested.1
- For a fixed compute budget, the best results came from training very large models and stopping "significantly short of convergence".1 In their fit, the best model size grew about 5 times for each 10 times more compute, while the data used grew only about 2 times.1
Summary B: Hoffmann et al. (2022)
Hoffmann and colleagues asked the same allocation question again. They trained over 400 language models, from 70 million to over 16 billion parameters, on 5 to 500 billion tokens.2 They concluded that "for every doubling of model size the number of training tokens should also be doubled".2
They tested that prediction. An earlier 280-billion-parameter model had been trained on 300 billion tokens. With the same compute budget, they trained a new model: 70 billion parameters on 1.4 trillion tokens.2 The 70-billion-parameter model outperformed the 280-billion-parameter model and three other models, all larger than 70 billion parameters, "on a large range of downstream evaluation tasks".2 (Of those four, only one was larger than the 280-billion-parameter model.)2 Below, "the 280B model" and "the 70B model" mean these two.
Comparing the two
| Summary A (Kaplan et al., 2020) | Summary B (Hoffmann et al., 2022) | |
|---|---|---|
| What was measured | Test loss of language models1 | Final pre-training loss of language models2 |
| As compute grows, model size should grow… | Fast: size proportional to compute^0.731 | About as fast as data: exponent about 0.46 to 0.50, by three methods2 |
| Tested at large scale by | Fits across many runs, with models up to about 10^9 parameters (excluding embeddings)1 | One comparison at large scale: the 70B model against the 280B model2 |
| Limits the authors state | No "solid theoretical understanding" of the laws, so "it's difficult to determine in what circumstances they can be trusted"1 | Only "two comparable training runs at large scale"; some curvature suggests "we may still be overestimating the optimal size of large models"; all runs used "less than an epoch of data"2 |
Two careful teams, both fitting smooth curves to loss, reached different answers on how to spend compute.2 That is the first lesson of a scaling law: it is a fit to a set of runs, under one setup, and its numbers can move when the setup changes. Kaplan et al. say their constants "depend on the vocabulary size and tokenization and hence do not have a fundamental meaning".1
What the summaries support: a conditional prediction about loss
These fitted loss laws support a prediction of this form, and only with its conditions attached: within the range and setup the fit describes, a larger model reaches a lower loss, by roughly this much, provided training data and compute are not the limit.
- From Summary A: doubling parameters, while data and compute are not the bottleneck, should cut loss by about 5%.1
- From Summary B: at a fixed compute budget, bigger is not automatically better. A smaller model trained on more tokens can reach lower loss than a bigger model trained on fewer. That is the prediction the 70B model was built to test, and on loss it held.2
So "make it bigger and the loss falls" is not the supported claim. The supported claim names the size, the data, the compute and the fitted range together.
What they do not support: a prediction about a specific ability
Neither paper forecasts which tasks a bigger model will be able to do. Kaplan et al. say so directly: "it will be important to investigate whether continued improvement on the loss translates into improvement on relevant language tasks".1 They add that "the smooth improvements in language model loss may hide seemingly qualitative changes in capability".1
The 70B model did do better on downstream tasks than the 280B model, including a 67.5% average on the MMLU benchmark.2 But that is a measured result for one pair of models, reported after training. The fitted law predicted the loss. It did not say in advance which tasks would improve, or by how much.
- Supported: within the fitted range, a lower loss for a larger model when data and compute are not the limit, or for a better-allocated model at a fixed budget.12
- Not established: "A model ten times bigger will be able to read our contracts reliably." No loss fit here names a task.
- Unresolved: how loss maps to a particular ability, and how far beyond the tested range the fits hold.12
2. Emergence: a sudden jump on a chart
The claim
Some papers have described emergent abilities: abilities "not present in smaller-scale models but are present in large-scale models; thus they cannot be predicted by simply extrapolating the performance improvements on smaller-scale models".3 Two properties make the claim striking: sharpness (from absent to present almost at once) and unpredictability (at a scale no one could foresee).3
What the paper did
Schaeffer, Miranda and Koyejo (2023) tested a different explanation. They collected answers from one family of language models that a company offered through its online interface, four sizes from 350 million to 175 billion parameters, on two arithmetic tasks: multiplying two 2-digit numbers and adding two 4-digit numbers.3 Then they scored the same answers two ways.3
- Scored by accuracy. An answer scores 1 only if every digit is exactly right, otherwise 0. On targets of 4 or 5 digits, the chart shows the sharp, late jump that had been reported as emergence.3
- Scored by token edit distance. An answer scores by how many single-token edits it would take to turn it into the right answer, so a nearly-right answer gets partial credit. With the answers unchanged, performance improved "smoothly, continuously and predictably" with scale.3
The model outputs did not change between the two scorings. Only the scoring did. That is metric sensitivity. The paper's own pair of plots is its Figure 3.3
The two supplied plots: a course-made example
These numbers are invented for this course to show the effect. They are not the paper's data, and no real or simulated answers were scored to make them. We imagine five models, A (smallest) to E (largest). We assume each gets any one digit of a 5-digit answer right with probability p, that p rises steadily with size, and that digits are right or wrong independently. The paper uses the same simplification to explain its result, and its authors say independence is "not true" of real models.3
From that model we computed each model's expected score under two metrics. These are paired expected-score curves: the same assumed models, the same assumption, two scoring rules. They stand in for the paper's real pair, which scored the same actual outputs both ways.
Plot 1 is the expected all-or-nothing score (all 5 digits right). Each block is 5 percentage points.
Plot 1: expected share of answers fully right (all-or-nothing)
A |                0.2%
B |                1.8%
C | ██             7.8%
D | █████         23.7%
E | ████████████  59.0%
Plot 2 is the expected partial-credit score for the same assumed models: digits right out of 5. Each block is a quarter of a digit.
Plot 2: expected digits right out of 5 (partial credit)
A | ██████              1.5
B | █████████           2.25
C | ████████████        3.0
D | ███████████████     3.75
E | ██████████████████  4.5
The same data as a table:
| Model | Chance each digit is right (p) | Plot 1: all 5 right (*p*⁵) | Plot 2: digits right out of 5 (5*p*) |
|---|---|---|---|
| A | 0.30 | 0.2% | 1.5 |
| B | 0.45 | 1.8% | 2.25 |
| C | 0.60 | 7.8% | 3.0 |
| D | 0.75 | 23.7% | 3.75 |
| E | 0.90 | 59.0% | 4.5 |
Plot 2 climbs by the same step at every size. Plot 1 sits near zero, then climbs fast. Same assumed models, two scoring rules, two pictures. In this example, the jump comes entirely from the scoring, because we built it that way. Real answers vary around these averages, and real data need not be so tidy.
Too few test questions makes it worse
A second cause is resolution. The paper reports that with too few test questions, the performance of small models cannot be estimated accurately.3 Our arithmetic, on the example above: if each model answers 20 test questions, and the questions are independent with the same chance of success each time, model A's true all-or-nothing rate of 0.2% gives about a 95% chance of seeing zero right answers, and model B's 1.8% gives about a 69% chance. A zero observed on a small test is not a true zero rate. Ask "out of how many?" before you read a zero. When the authors generated more test data, every model in the family scored above chance on both tasks, even by accuracy.3
Beyond one model family
The paper ran two further checks. On BIG-Bench, a large public benchmark, possible emergent abilities showed up under at most 5 of its 39 preferred metrics, and over 92% of the hand-labelled cases used one of two all-or-nothing metrics.3 For a second model family, whose published results they re-scored, abilities that looked emergent under a multiple-choice grade disappeared under a continuous metric, the Brier score.3 And in vision models, the authors produced new "emergent" abilities on purpose by choosing a strict metric.3
What remains unresolved
The authors draw a careful line: "nothing in this paper should be interpreted as claiming that large language models cannot display emergent abilities".3 They cite other researchers who argue some emergence may be real under other assumptions.3 Kaplan et al. had also warned that smooth loss "may hide seemingly qualitative changes in capability".1
A smooth graded plot shows the jump is sensitive to the metric. It does not, by itself, show the scoring was the only cause of the jump. So a good critique of a jump on a chart does not end in "the ability is fake" or "the ability is real". It ends in a bounded statement:
- Supported: this jump is sensitive to the metric. Under a graded metric, the same outputs improve smoothly.3
- Not established: that a new ability switched on at that scale. The sharp chart alone does not show it.
- Unresolved, in this comparison: whether the underlying skill changes in kind at some scale. A smooth graded score does not prove there is no change of kind, and the paper does not claim it does.3 Whether later studies settled the question is not checked here.
Questions to ask of any emergence chart: How was each answer scored? How many test items were there at the small end, out of how many? Is there a graded score for the same outputs? How many tasks and metrics were looked at before this one was shown? On that last point, the authors note BIG-Bench alone has at least 220 tasks, about 40 metrics per task and about 10 model families, so some jumps could appear by chance.3 Those combinations are not independent tests, so this is a warning to ask, not a count of false alarms.
3. Chain of thought: is the written reasoning the real reason?
The experiment
When a model writes out step-by-step reasoning before its answer (chain of thought, or CoT), it is tempting to read that reasoning as the model's actual process.4 Turpin, Michael, Perez and Bowman (2023) tested this with two commercial models available in 2023.4
They added a biasing feature to the prompt, something that should not matter but pushes toward one answer.4 In one version, all the worked examples in the prompt had the right answer at "(A)" ("Answer is Always A"). In another, the prompt added a line such as "I think the answer is A but I'm curious to hear what you think" ("Suggested Answer").4 Then they checked two things: did the answer change, and did the written reasoning mention the bias?
The results
- The biasing features changed answers a great deal. On 13 BIG-Bench Hard tasks, accuracy fell by as much as 36 percentage points when the bias pointed to a wrong answer.4 That largest drop is one setting: one model, the Suggested Answer bias, no worked examples.4 The paper writes it as 36%; it is a difference between two accuracy rates.
- The reasoning almost never mentioned the bias. The authors reviewed 426 explanations that supported a biased answer. Only one of the 426 explicitly mentioned the bias.4
- The reasoning often changed to fit the biased answer. The authors hand-annotated a sample of 104 unfaithful explanations. As many as 73% of that sample argued for the bias-consistent answer, and 15% had no obvious errors.4 Those are shares of the 104, not of every explanation the models wrote.
One example from the paper: asked whether "Wayne Rooney shot from outside the eighteen" is plausible, one of the models reasoned correctly to "plausible" without the bias. With the bias, it reasoned that "the eighteen" probably belongs to American football or golf, and answered "implausible".4 The reasoning read well. It did not mention the bias that changed the answer.
The supported conclusion
Supported: a model's written reasoning can systematically leave out a factor that changed its answer, while still reading as a sensible argument for that answer.4 So a plausible explanation is not, on its own, evidence that it is the real reason. The paper's word for an explanation that does reflect the real reason is faithful. That is a claim about cause, not about intent: nothing here shows a model "meant" to mislead. The authors warn that such explanations risk "increasing our trust in LLMs without guaranteeing their safety".4
One limit (there are several)
The authors state the main one themselves: their test "allows us to identify failures, but not prove explanations are faithful". It is "a necessary but not sufficient test for faithfulness".4 It also "only evaluates faithfulness with respect to minor modifications of the input".4
So:
- Not established: "Chain-of-thought reasoning is always unfaithful." The test finds failures under specific planted biases. It does not show what happens without them.
- Not established: "A model that passes this test gives faithful reasoning." Passing is necessary, not sufficient.4
- Unresolved: how today's models behave. The tested models were from 2023.4 This module has not checked later results. Before relying on a newer model's reasoning, ask for a planted-cue test of that model.
4. Toy superposition: a mechanism in a small network
The question
It would be convenient if each neuron in a network stood for one clean idea. Researchers report that often it does not: one neuron responds to several unrelated things. That is called polysemanticity, and it makes networks harder to interpret.5 In large language models, the authors note, it "actually seems rare for neurons to correspond to clean features".5 That is their observation about large models. It is not a result of the toy study below.
The toy model
Elhage and colleagues (2022) built toy models: "small ReLU networks trained on synthetic data with sparse input features".5 A feature is sparse if it is zero most of the time. In the simplest setup, the network must squeeze several features into fewer dimensions and then rebuild them.5 In this setup a feature is stored as a direction in a small space, not as one neuron each. The opening example uses the version that ends in a ReLU, a function that turns negative values into zero.5
The paper's first example: five features of different importance, squeezed into two dimensions.5
- When the features are dense (often active), the network keeps the two most important features at right angles and drops the other three, much as Principal Component Analysis would.5
- When the features are sparse, this changes. The network stores more features than it has dimensions, accepting some interference between them, and uses its ReLU to filter it out.5
The supplied diagram: a course-made sketch
This sketch is drawn for this course. It is not the paper's figure, and the angles are schematic.
DENSE features (often on)               SPARSE features (rarely on)

      dimension 2                              dimension 2
          ^                                  f3    ^    f2
          | f2                                 \   |   /
          |                                     \  |  /
          +------> f1   dimension 1              \ | /
                                                   +------> f1
   f3, f4, f5: not stored                         / \
                                                 /   \
                                               f4     f5
Text version of the sketch:
- Dense case: two arrows at right angles, one for feature 1 and one for feature 2, the two most important. Features 3, 4 and 5 have no arrow; the network does not store them.
- Sparse case: five arrows share the same two dimensions, one per feature. They cannot all be at right angles, so reading one arrow picks up a little of its neighbours. That leak is the interference.
Why can the sparse case live with the interference? Our reasoning, not a quote, and it rests on an assumption of our sketch: each feature switches on independently of the others. Then, if each feature is on only rarely, two features are rarely on at the same time. Most of the time, when one feature is on, its neighbours are off, so there is little to leak. The paper reports that the network tolerates the interference that remains and filters it with the ReLU.5
Rarity alone does not give you that. Two features can each be rare and still nearly always fire together. Then, whenever one is on, the other is too, and the leak is there every time. The argument above covers features that switch on independently, not every pair of rare features.
Storing more features than dimensions is what the authors call superposition.5 They report that whether a feature is stored this way is "governed by a phase change", and that the stored features form geometric shapes such as "digons, triangles, pentagons, and tetrahedrons".5 In their experiments, which regime appears depends on both how sparse and how important the features are.5
What it shows, and what it does not
- Supported: in these toy ReLU-output networks, superposition happens, and whether it happens depends on how sparse and how important the features are.5 The authors call it "a direct demonstration that superposition occurs in artificial neural networks given a relatively natural setup, suggesting this may also occur in practice".5
- Not established: that superposition explains a particular decision by a deployed model. The experiment never looked inside a deployed model or traced any of its decisions.
- Not established: that "rarely used means packed in" holds for every network. The dense and sparse results above are for this toy setup.
- Unresolved: how far the toy results carry to real networks. The authors say so plainly: "it's very unclear what to generalize to real networks".5 They expect some findings, such as superposition itself, to be more likely to carry over, and others, such as the geometry and learning dynamics, to be "much more uncertain".5 They list "How realistic are these toy models?" as an open question.5
A toy model is like a wind-tunnel test on a scale model. It can show that a mechanism is possible and how it behaves under controlled conditions. It does not tell you why one particular full-size aircraft did what it did on one particular day.
At Big Widget Company (a made-up example)
Big Widget Company and everything in this section are invented for this course. The studies cited above are real.
A vendor pitches a model that would help decide warranty claims. Big Widget's AI review board, chaired by Jo, sorts the pitch. The board advises. Jo, as chair, owns the decision on what enters the decision record. The model does not decide that, and neither does the vendor.
| Vendor claim | Board's verdict | Why, and the next check |
|---|---|---|
| "Scaling laws prove our next model, ten times bigger, will handle claims involving custom parts." | Not established | A loss fit predicts lower loss, not a named ability.1 Next check: a measured result on a course-made set of custom-part claims, with its uncertainty and its "out of how many?" |
| "This chart shows warranty reasoning emerging suddenly at our largest size." | Supported only as a chart; the cause is unresolved | Ask how answers were scored, how many test items there were at the small end, and for a graded score on the same outputs.3 |
| "Every decision comes with step-by-step reasoning, so you can see why it decided." | Not established | Written reasoning can leave out the factor that changed the answer.4 Next check: planted-cue tests. A person stays on decisions that matter. |
| "Research on superposition explains why our model rejected claim 4471." | Not established | That research studied toy networks; the authors say what carries over to real networks is "very unclear".5 Drop the claim unless model-specific evidence exists. |
The board does not reject the vendor on these grounds alone. It writes down what is supported, what is not established and what is unresolved. Then it walks the Foundation's three yeses — Get to Yes, Stay at Yes and Recover to Yes6 — which this course treats as a cycle rather than a one-time approval:
- Get to Yes: before any use, Jo decides the exact permitted use: go ahead, only this far, wait for a person, or no.6 The board's draft is "only this far": the model may suggest, a person decides each claim. Unchecked vendor claims get "wait for a person" and stay out of the decision record. Jo is the person who can release that hold, and only on evidence.
- Stay at Yes: while the model runs, keep re-running the planted-cue and graded-score checks on each new model version. One good test is not the end.
- Recover to Yes: if a check fails, stop relying on the model for that use, name the owner of the fix, and revisit the rule. A planned fix is not yet a recovery. The board is back at yes only when the new check has run and been recorded.
What you keep. Keep your reading notes (which paper version you read, which claims you sorted, what is not checked, who decided) in a controlled work record. That record is not the receipt. The Foundation's Practice page lists what its receipt for a gate decision carries, "hashes, decision, tier, policy hash, key id", and what it never carries, "prompts, outputs, payloads, personal data".7 A key id identifies the signing key, not a named person, so the decision owner (Jo) is named in the work record. Claim details and customer data stay out of the receipt. A receipt shows a decision was made; it does not show the vendor's claims were true.
Summary
- Scaling laws fit how loss falls with size, data and compute, within a tested range and setup. A bigger model reaches lower loss only with those conditions attached. Two careful fits disagreed on how to split compute. Neither forecasts which abilities a bigger model will have.12
- Emergence charts can show a jump because of how answers were scored or how few test items there were. The same outputs can look smooth under a graded score. These papers do not settle whether some abilities change in kind; later work is not checked here.3
- Chain-of-thought reasoning can leave out what really changed the answer. The test that shows this can find failures but cannot prove faithfulness.4
- Toy-model mechanisms show what can happen in small networks. They do not explain a particular decision by a deployed model.5
- For any claim about how models work, say which of the three boxes it belongs in: supported, not established or unresolved. Where you do not know, say "not checked", and name who checks next.
Words to know: loss, token, scaling law, compute-optimal, emergent ability, metric sensitivity, resolution, chain of thought, faithfulness, biasing feature, polysemanticity, superposition, interference, toy model.
Further learning (optional, not citations)
Free public university course materials for learners who want more. Links only; nothing here is copied from them, and they support no claim in this module.
- Stanford University, CS336: Language Modeling from Scratch (Spring 2026): <https://cs336.stanford.edu/>. Lecture schedule with scaling and evaluation materials. Full training exercises may need paid GPU compute; none is required here.
- University of Oxford, Deep Learning for Natural Language Processing (2016–2017): <https://www.cs.ox.ac.uk/teaching/courses/2016-2017/dl/>. Historical NLP background; not a modern interpretability syllabus.
- Massachusetts Institute of Technology, 6.5940 TinyML and Efficient AI Computing (Fall 2026): <https://hanlab.mit.edu/courses/2026-fall-65940>. Efficiency and compute background; not evidence for predicting abilities.