
Why it works, and where it breaks · Technical gear
Scope
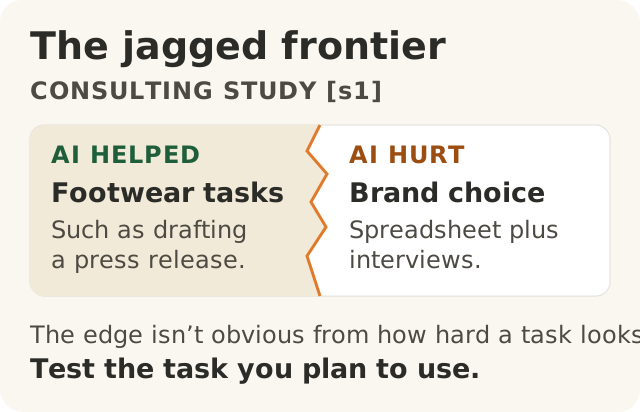
Figure data as text
The jagged frontier
Tasks in the consulting study (s1) | Which side? |
|---|---|
| Footwear tasks, such as drafting a press release | Inside the frontier: AI helped |
| Brand recommendation using a spreadsheet and interviews | Outside the frontier: AI hurt performance |
The sides do not share a numerical scale. How hard a task looks does not tell you which side it falls on. Test the task you plan to use (s1).
This gear reads three primary studies and one standard closely: a preregistered field experiment on consulting work,1 a study of customer-support productivity,2 a randomized trial of experienced software developers,3 and the NIST AI Risk Management Framework.4 The question throughout is the same: what does each study let us conclude about which tasks generative AI improves, and how we would know for our own tasks?
1. Capability is task-specific: evidence from three designs
1.1 Consulting tasks inside the frontier
Dell'Acqua et al. ran a preregistered, randomized experiment with 758 Boston Consulting Group consultants, in two non-overlapping arms: 385 subjects did the inside-the-frontier tasks and 373 the outside-the-frontier task (see section 2.2 of this gear).1 Outcomes in the two arms come from different people, so the comparison between arms is between tasks given to separate groups, not a within-person crossover. After a baseline assessment task, subjects were randomly assigned to one of three conditions: no AI, GPT-4 access, or GPT-4 access with a prompt-engineering overview.1 On 18 realistic tasks inside the frontier, spanning creativity, analytical thinking, writing and persuasiveness (for example, "Segment the footwear industry market based on users."), AI users completed 12.2% more tasks and completed them 25.1% more quickly on average.1 On grader-scored quality, the GPT-plus-overview condition scored 1.48 points above a control mean of 4.37 (a 33.9% increase) and the GPT-only condition 1.31 points above it (29.9%).1
Both the top-half and bottom-half performers on the baseline task improved, with the bottom half gaining more.1
1.2 Customer support
Brynjolfsson, Li and Raymond studied 5,179 customer-support agents. Access to a generative AI assistant increased issues resolved per hour by 14% on average and by 34% for novice and low-skilled workers, with minimal impact on experienced and highly skilled workers.2 The authors give suggestive evidence, not an established account, for a mechanism: the model disseminates the best practices of more able workers and helps newer workers move down the experience curve.2 This lesson uses the April 2023 NBER working-paper figures throughout. The later journal version reports different samples and estimates (see sources.yml).2
1.3 Experienced developers on mature projects
Becker et al. (METR) randomly assigned each of 246 tasks, done by 16 developers in mature open-source projects, to allow or disallow early-2025 AI tools (primarily Cursor Pro with Claude 3.5/3.7 Sonnet). Allowing AI increased completion time by 19%.3
1.4 What the three together support
The pattern is heterogeneity along two axes, task and worker:
| Improved | Not improved or harmed | |
|---|---|---|
| Task | Ideation, drafting, writing, persuasion, structured first-pass analysis1; support conversations2 | A recommendation whose correct answer depends on qualitative evidence that contradicts a seemingly complete spreadsheet1 |
| Worker | Novices and lower-skilled workers gain most12 | Experienced workers: minimal effect in support2; slower in the developer trial (early-2025 tools; METR now marks the result out of date, section 3.2)3 |
None of these studies supports a claim of the form "generative AI improves knowledge work" without a task and a population attached. Equally, the table is not a general rule about expert work: the top-half performers in the consulting experiment also improved on the inside-the-frontier tasks.1 Each cell is conditional on its task, its population, its tools and its date, and is a prior for where to test rather than a prediction.
2. The jagged technological frontier
2.1 Definition
The paper's abstract defines the "jagged technology frontier" (the title and body say "technological") as "the uneven impact of artificial intelligence (AI) capabilities, where AI assistance improves performance for some tasks but worsens it for others, even within the same knowledge workflow and with a seemingly similar level of difficulty."1 Inside the frontier, AI can complement human work. Outside it, "AI output is inaccurate, is less useful, and can degrade human performance."1
The key property is that perceived difficulty is no guarantee of which side a task falls on.1 As a conceptual restatement (this notation is ours; the paper does not fit such a model): for a task t let Δ(t) be the treatment effect of AI access on a quality or correctness measure, and d(t) its perceived difficulty. The frontier claim is that Δ(t) can change sign across tasks of seemingly similar d(t), so d(t) alone does not settle the sign of Δ(t). That rules out difficulty as a guarantee; it does not show difficulty carries no information. The paper reports no matched difficulty ratings for its two task arms, and its Figure 1 is stylized rather than a plot of the measured tasks.1
2.2 The outside-the-frontier task
The authors built this task, with BCG, to be one at which consultants would excel but AI would struggle. Subjects analysed brand performance from a spreadsheet and a file of insider interviews and recommended which brand had the most growth potential. The spreadsheet was designed to seem comprehensive. Only careful reading of the interview notes revealed the crucial details.1 Correctness was scored as a binary outcome.1
The control group was correct about 84.5% of the time. The GPT-plus-overview group was correct 60% of the time and the GPT-only group 70.6%.1
2.3 Percentage points versus percent
These figures show why the unit matters. With p_c the control proportion correct and p_a the treated proportion, both as proportions between 0 and 1:
Δpp  = 100 × (p_a − p_c)    (difference in percentage points)
Δrel = (p_a − p_c) / p_c (relative change)| Condition | Δpp | Δrel (computed here) |
|---|---|---|
| GPT + overview | 100 × (0.600 − 0.845) = −24.5 points | −0.245 / 0.845 ≈ −29% |
| GPT only | 100 × (0.706 − 0.845) = −13.9 points | −0.139 / 0.845 ≈ −16% |
The paper reports the two decreases as 24.5% and 13.9%, and the average decrease across the AI conditions as 19 percentage points.1 Its abstract says subjects using AI were "19% less likely to produce correct solutions".1 The body makes clear this is a difference in percentage points. When you repeat a figure like this, say which unit it is.
2.4 Why the edge is invisible from the inside
The paper points to properties of the models that hide the frontier from users. LLMs can produce incorrect but plausible results that users find "believable", and they "fail in other circumstances in ways that are difficult to predict in advance".1 This is a risk, not a guarantee: not every wrong output reads as plausible, but fluency is not evidence of correctness. On the brand task, the error could only be caught by checking against the interviews,1 and AI-assisted recommendations were more coherent and persuasive than unassisted ones among both correct and incorrect answers.1
The practical consequence is that the frontier has to be mapped empirically, task by task, in the context of use. The NIST AI RMF makes the same point in risk terms. The MAP function "establishes the context to frame risks related to an AI system", and its outcomes "are the basis for the MEASURE and MANAGE functions".4 MEASURE 2.3 calls for performance to be "measured qualitatively or quantitatively and demonstrated for conditions similar to deployment setting(s)".4 The framework also warns that measurements made "in a laboratory or a controlled environment ... may differ from risks that emerge in operational, real-world settings".4
3. Perceived versus measured effect
3.1 The METR result
Let T_AI and T_noAI be expected completion times with and without AI allowed. The METR study reports three quantities that are easy to compare as ratios:3
| Quantity | Reported | As a ratio T_AI / T_noAI |
|---|---|---|
| Developers' forecast before the study | 24% shorter | ≈ 0.76 |
| Developers' estimate after the study | 20% shorter | ≈ 0.80 |
| Measured | 19% longer | ≈ 1.19 |
| Forecasts by economics experts | 39% shorter | ≈ 0.61 |
| Forecasts by ML experts | 38% shorter | ≈ 0.62 |
The ratio column is a direct rewrite of the stated percentages, not the paper's estimator. The direction of the error is what matters. The developers' after-the-fact estimate, made with the experience fresh, was on the wrong side of 1.3 So were the forecasts by outside experts.3
3.2 Limits on the result
Three limits keep this result in its place:
- Dated tools. As of November 2026, METR marks these results out of date and says they "no longer reflect the current impact of AI models on open-source developer productivity". It published new data on late-2025 tools in February 2026.3 This gear has not checked those newer data, so it makes no claim about the current sign of the effect in this setting: not checked.
- A narrow setting. The study was designed for experienced open-source developers working on projects they know well. METR does not claim the developers or repositories represent most software work, and says AI tools are plausibly useful elsewhere, for example for less experienced developers or in unfamiliar codebases.3
- No journal record. The paper was posted on arXiv; as of 16 November 2026 its arXiv record lists no journal publication.3 The authors say the influence of experimental artifacts "cannot be entirely ruled out", though they argue the slowdown is unlikely to be mainly a product of the design.3
What survives these limits is the methodological point. Experienced, motivated people misjudged the sign of the effect on their own work. Self-report should therefore not be the outcome measure for an AI rollout. When repeating any effect size, carry its population, comparison, metric, time window and uncertainty with it, not just the percentage.
3.3 What a measurement needs
Each of the three studies compares work with and without AI: by random assignment in the consulting and developer trials,13 and through a staggered rollout of the assistant in the support study.2 Each measures the actual work (tasks completed, issues resolved per hour, correctness, time) rather than how it felt.123 They differ in what they fixed before seeing results. The consulting experiment was preregistered.1 The developer trial defined its tasks before randomizing them.3 The cited support-study material does not describe a preregistration; that is not evidence its outcome was chosen afterwards, only that this lesson cannot claim it was fixed in advance. NIST puts the operational version as: "AI systems should be tested before their deployment and regularly while in operation."4
4. Worked example: Big Widget Company (made up)
Big Widget Company is invented for this course. What follows is a measurement plan; it contains no figures and reports no data.
Sam's customer service team pilots an AI helper.
- Map. Split the work into task types, for example product questions, returns, and warranty disputes that depend on correspondence history. These labels are hypothetical; which ones AI helps with is what the pilot is for. Do not assume one result carries over to another.14
- Measure. For each task type, compare a with-AI group and a without-AI group (randomise by ticket where possible) on issues resolved per hour and on correctness. Each study above rests on a comparison like this.123 Have correctness checked by a reviewer who does not know which group the ticket came from.
- Decide by task, not by tool. If, say, product questions improve and warranty disputes get worse, the decision is "AI for product questions, a person for disputes", not "AI good" or "AI bad".1 A before-and-after count can flag a change for monitoring, but on its own it cannot attribute the change to AI, because question mix, staffing and season shift too.
- Re-measure. Repeat after model updates and as staff change, because the effect differs by experience and by task and the tools change.234
4.1 The three yeses, measurement subset
The Foundation's manifesto maps its gates to three movements: Get to Yes (before an action runs or a rule ships), Stay at Yes (while it runs) and Recover to Yes (after, on demand or on incident).5 This plan supplies only the measurement inputs to each.
- Get to Yes. The task type has been tested in conditions like real use.4 The pilot result is evidence for a named person's decision (here Sam, as owner). It is not a decision the tool makes.
- Stay at Yes. The measures in step 2 keep running; satisfaction surveys alone do not count.34 Re-measure on model updates and staff changes (step 4). An initial yes is conditional, not a standing licence.
- Recover to Yes. If a wrong dispute answer reaches a customer: stop AI use on that task type, have a person correct the reply to the customer, name the owner, inspect the pilot records, and change the routing rule. Resume only when re-measurement shows the changed rule works. A stop and an announced fix are not, by themselves, evidence of recovery.
Measured performance is necessary but not sufficient for permission. A Foundation gate decides among go ahead, only this far, wait for a person, or no,5 and the manifesto rules out a direct model-to-tool path for consequential actions.5 A measured effect can inform "go ahead" or "only this far" for a task type; it does not settle data handling, ownership or action scope. This plan assumes an approved tool, customer data that is safe to share with it, a named owner who reviews consequential replies, and a written rule for what the AI may do; modules 100.7 and 100.9 treat those conditions.
4.2 Work records versus receipts
The pilot produces sensitive working material: customer correspondence, model outputs and reviewer correctness marks. Keep it, as far as workplace policy permits, in a separately controlled work record. The manifesto requires that a gate's signed receipt hold no private content.5 Prompts, outputs and customer details therefore do not belong in a receipt. A receipt also says nothing about whether a model's answer was correct; that is what the pilot's blinded review measures.
Further learning (not a citation)
For optional background on evaluating predictive models in real domains, MIT OpenCourseWare publishes The Analytics Edge (15.071, Spring 2017): https://ocw.mit.edu/courses/15-071-the-analytics-edge-spring-2017/. It is not a course on generative AI productivity.